Relative Strength Index (RSI) is a popular momentum oscillator
developed by J. Welles Wilder Jr. and detailed in his book New
Concepts in Technical Trading Systems.
The Relative Strength Index compares upward movements in closing
price to downward movements over a selected period. Wilder originally
used a 14 day period, but 7 and 9 days are commonly used to trade the
short cycle and 21 or 25 days for the intermediate cycle. Please note
that Wilder does not use the standard moving average formula and the
time period may need adjustment.
Relative Strength Index is smoother than the Momentum or Rate of
Change oscillators and is not as susceptible to distortion from
unusually high or low prices at the start of the window (detailed in
Momentum
Construction). It is also formulated to fluctuate between 0 and 100,
enabling fixed Overbought and Oversold levels.
See Construction
for further details.
Trading Signals
Different signals are used in trending
and ranging
markets. The most important signals are taken from overbought and
oversold levels, divergences
and failure
swings.
Use trailing
buy- and sell-stops to time entry into trades.
Ranging Markets
Set the Overbought level at 70 and Oversold at 30.
-
Go long when RSI falls below the 30 level and rises back above
it
or on a bullish divergence
where the first trough is below 30.
-
Go short when RSI rises above the 70 level and falls back below
it
or on a bearish divergence
where the first peak is above 70.
Failure
swings strengthen other signals.
Trending Markets
Only take signals in the direction of the trend.
-
Go long, in an up-trend, when RSI falls below 40 and rises back
above it.
-
Go short, in a down-trend, when RSI rises above 60 and falls
back below it.
Exit using a trend indicator.
Take profits on divergences.
Unless confirmed by a trend indicator, Relative Strength Index
divergences are not strong enough signals to trade in a trending market.
Example
Wal-Mart Stores Inc. is plotted with a fuchsia
21 day exponential
moving average (MA) and aqua
9 day Relative Strength Index. A 2-day closing filter
is used with the MA.
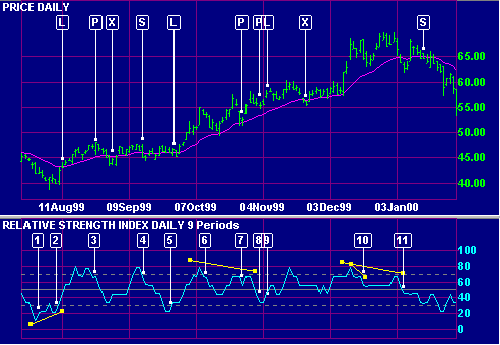
- Price is trending downwards (staying below the moving average). Do
not take long signals until the MA turns upward, otherwise we are
trading against the trend.
- A bullish divergence
on Relative Strength Index is reinforced by completion of a failure
swing at [2]. Go long [L] when the MA slopes upwards and RSI
crosses to above 40.
- RSI completes a minor failure swing at [3]. Take profits [P] and
exit the remaining position [X] when there are two closes below the
MA.
Do not go short as price is trending upwards (staying above the
moving average).
- Price has started to fluctuate around the moving average,
signaling a ranging market. Go short [S] when RSI crosses from above
to below 70.
- Go long [L] when RSI crosses from below to above 30.
- There has been a breakout from the trading range and price is
trending upwards. Do not close the long position.
- Take profits [P] on the bearish divergence (Price has completed a
higher peak while RSI has experienced a lower peak).
- Take profits [P]. A bearish triple
divergence is confirmed by completion of a large failure swing
at [8].
- Increase your long position [L]. RSI has crossed from below to
above 40 during an up-trend.
Exit your position [X] when there are two closes below the MA. Do
not go short as the MA still slopes upwards.
- A small bearish divergence warns of a possible trend reversal.
- A bearish triple
divergence is reinforced by completion of a failure
swing at [11]. Wait until the MA has turned down and RSI has
crossed to below 60 before entering a short trade [S].
Construction
The steps in calculation of the Relative Strength Index are:
- Decide on the RSI Period, based on the time
frame that you wish to analyze.
- Compare Closing price [today] to Closing price [yesterday].
- For the RSI Period, add all upward movements in Closing price.
- For the RSI Period, add all downward movements in Closing price.
- Calculate the exponential moving average* of price movements:
Average Upward Price Move = Exponential Moving Average of Upward
Movements
Average Downward Price Move = Exponential Moving Average of Downward
Movements
- Calculate Relative Strength (RS):
RS = Average Upward Price Move / Average Downward Price Move
- Calculate the Relative Strength Index (RSI):
RSI = 100 - 100 / ( 1 + RS )
Users should beware, when setting time periods for Welles Wilder's
indicators, that he does not use the standard exponential moving average
formula. For example, Wilder describes 1/14 of today's data + 13/14
of yesterday's average as a 14-day exponential moving average. If
you refer to Exponential
Moving Averages you will see the formula equates to a 27-day
exponential moving average.
Indicators affected are:
We recommend that users try shorter time periods when using one of
the above indicators. For example, if you are tracking a 30-day cycle
you would normally select a 15-day Indicator
Time Period. With the RSI, adjust the time period as follows:
RSI time period = (n
+ 1) / 2 = (15 + 1) / 2
= 8 days
Alternatively, select the Exponential moving average option (for RSI
or ATR) in place of the default Wilder moving average