The Stochastic Oscillator was developed by Dr. George Lane to track market
momentum.
The indicator consists of two lines:
- %K compares the latest closing price to the recent trading range.
- %D is a signal line calculated by smoothing %K.
The number of periods used in the indicator can be varied according to the
purpose for which the Stochastic is used:
| Purpose: |
%K Periods |
%D Periods |
Overbought level |
Oversold level |
Comments: |
| Combine with trend indicator |
5 to 10 days |
3 days |
80% |
20% |
Very sensitive |
| Stand-alone or trade longer cycles |
14 or 21 days |
3 days |
70% |
30% |
Only shows important turning points |
The formula is explained at Construction.
Slow
Stochastic incorporates further smoothing and is often used to provide a
more reliable signal.
Trading Signals
If the Stochastic hovers near 100 it signals accumulation.
Stochastic lurking near zero indicates distribution.
The shape of a Stochastic bottom gives some indication of the ensuing rally.
A narrow bottom that is not very deep indicates that bears are weak and that the
following rally should be strong. A broad, deep bottom signals that bears are
strong and that the rally should be weak.
The same applies to Stochastic tops. Narrow tops indicate that the bulls are
weak and that the correction is likely to be severe. High, wide tops indicate
that bulls are strong and the correction is likely to be weak.
Ranging Markets
Signals are listed in order of their importance:
- Go long on bullish divergence
(on %D) where the first trough is below the Oversold level.
- Go long when %K or %D falls below the Oversold level and rises back above
it.
- Go long when %K crosses to above %D.
Short signals:
- Go short on bearish divergence
(on %D) where the first peak is above the Overbought level.
- Go short when %K or %D rises above the Overbought level then falls back
below it.
- Go short when %K crosses to below %D.
Place stop-losses
below the most recent minor Low when going long (or above the most recent minor
High when going short).
%K and %D lines pointed in the same direction are used to confirm the
direction of the short-term trend.
Lane also used Classic
Divergences, a type of triple divergence.
Trending Markets
Only take signals in the direction of the trend and never go long when
Stochastic is overbought, nor short when oversold.
Use trailing
buy- and sell-stops to enter trades and protect yourself with stop-losses.
Long:
If %K or %D falls below the Oversold line, place a trailing
buy-stop. When you are stopped in, place a stop loss below the Low of the
recent down-trend (the lowest Low since the signal day).
Short:
If Stochastic rises above the Overbought line, place a trailing
sell-stop. When you are stopped in, place a stop loss above the High of the
recent up-trend (the highest High since the signal day).
Exit:
Use a trend
indicator to exit.
Example
The Slow
Stochastic Example illustrates the trading signals. This study focuses on
the trailing
stop entry technique used in a trending market.
Intel Corporation is shown with a blu
21 day exponential
moving average (MA) and 7 day Stochastic fuchsia
%K and aqua
%D. The MA is used as the trend indicator with closing price as a filter.
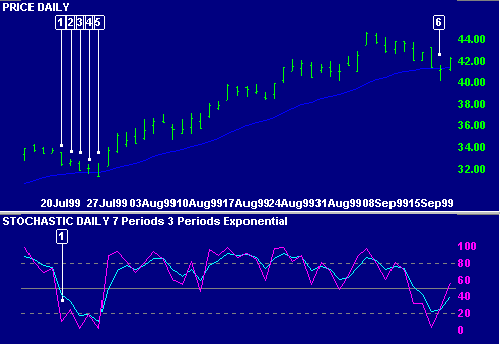
- %K falls below 20. Place atrailing
buy-stop just above the day's High of $33 1/2.
- Move the buy-stop down to $33, above the High of day 2.
- Move the stop down to above the High of day 3.
- Move the stop down to $32 1/2 - one tick above the High on day 4.
- The day opens with a new Low of $31 3/8 and then rises until we are
stopped in at $32 1/2. Place a stop-loss below the Low (i.e.. the lowest Low
since day [1]). Thereafter, price falls back to the day's Low, but fails to
activate the stop-loss one tick below.
- Exit when price closes below the MA.
Slow Stochastic
The Slow Stochastic applies further smoothing to the Stochastic oscillator,
to reduce volatility and improve signal accuracy.
Details of the formula can be found at Construction.
Trading Signals
Trading signals are the same as for the Stochastic oscillator.
Ranging Markets
Signals are listed in order of their importance:
- Go long on bullish divergence
(on %D) where the first trough is below the Oversold level.
- Go long when %K or %D falls below the Oversold level and rises back above
it.
- Go long when %K crosses to above %D.
Short signals:
- Go short on bearish divergence
(on %D) where the first peak is above the Overbought level.
- Go short when %K or %D rises above the Overbought level then falls back
below it.
- Go short when %K crosses to below %D.
Place stop-losses
below the most recent minor Low (or above the most recent minor High) when going
long (or short).
Trending Markets
Only take signals in the direction of the trend and never go long when
Stochastic is overbought, nor short when oversold.
The shape of a Stochastic bottom gives some indication of the ensuing rally.
A narrow bottom that is not very deep indicates that bears are weak and that the
following rally should be strong. A broad, deep bottom signals that bears are
strong and that the rally should be weak.
The same applies to Stochastic tops. Narrow tops indicate that the bulls are
weak and that the correction is likely to be severe. High, wide tops indicate
that bulls are strong and the correction is likely to be weak.
Use trailing
buy- and sell-stops to enter trades and protect yourself with stop-losses.
Long:
If the Stochastic (%K or %D) falls below the Oversold line, place a trailing
buy stop. When you are stopped in, place a stop loss below the Low of the
recent down-trend (the lowest Low since the signal day).
Short:
If Stochastic rises above the Overbought line, place a trailing
short stop. When you are stopped in, place a stop loss above the High of the
recent up-trend (the highest High since the signal day).
Exit:
Use a trend
indicator to exit.
Johnson & Johnson is plotted with a red
21 day exponential
moving average (MA) and 5 day Slow Stochastic with fuchsia
%K and aqua
%D. Overbought/oversold levels silver
are set at 70/30. Closing price is used as a filter
on the MA.
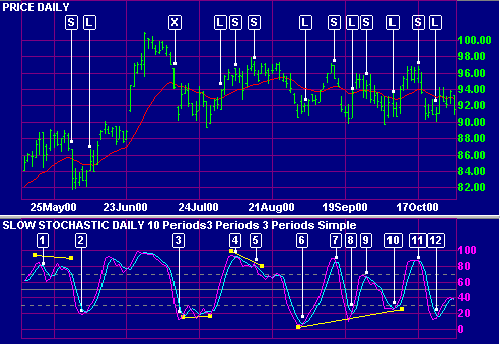
- The market is trending upwards (price above the MA). %K twice crosses to
above 80. Wait until the MA turns down before going short [S].
- %K crosses to below 20. Go long [L] when the MA turns upwards. Exit [X]
when price closes below the MA.
- %K crosses to below 20. Go long [L] when the MA turns upwards.
- Price has been fluctuating around the MA which indicates that the market
is ranging. Adjust the trading signals and overbought/oversold levels.
Go short [S] when %K crosses to below % D. The trade is stopped out by a
rally above the last minor High.
- A bearish divergence
on %D signals to re-instate the short [S] position.
- %K crosses to above %D, signaling to go long [L].
- %K signals to go short [S] when it crosses below %D.
- A bullish divergence on %D signals to go long [L].
- %K rises above 70 and turns back below. Go short [S].
- There is a bullish, triple
divergence on %D. Go long [L].
- %K crosses to below % D. Go short [S].
- Go long [L] when %K crosses to above %D. The market is still ranging, with
price fluctuating around the MA.
Remember that the days shown are the signal days and that trades are only
entered on the following day. Take a look at the exit [X] from [2]. Adjusting
Stop Levels may provide faster exits.
Stochastic Oscillator
Construction
To calculate the Stochastic Oscillator:
- The first step is to decide on the number of periods (%K Periods)
to be included in the calculation. The norm is 5 days, but this should be
based on the time
frame that you are analyzing.
- Then calculate %K, by comparing the latest Closing price to the range
traded over the selected period:
CL
= Close [today] - Lowest Low [in %K Periods]
HL
=Highest High [in %K Periods] - Lowest Low [in %K Periods]
%K
= CL / HL *100
- Calculate %D by smoothing %K. The original formula used a 3 period simple
moving average, but this can be varied, based on the time
frame that you are analyzing.
Slow Stochastic Oscillator
Construction
Many traders find the Stochastic Oscillator too volatile and prefer to use
the Slow Stochastic:
- The %K [Slow] is equal to the %D [Fast] from the above formula.
- The %D [Slow] is calculated by smoothing %K [Slow]. This is normally
done using a further 3 period simple
moving average.