The MACD is basically a refinement of the two
moving averages system and measures the distance between the two moving
average lines. Signals are taken when MACD crosses its signal line, calculated
as a 9 day exponential
moving average of MACD.
The indicator is primarily used to trade trends and should not be used in a
ranging market.
MACD was developed by Gerald Appel and is discussed in his book, The
Moving Average Convergence Divergence Trading Method. For further details,
see MACD
Construction.
Trading Signals
First check whether price is trending. If MACD is flat or stays close to the
zero line, the market is ranging and signals are unreliable.
Trending Market
-
Go long when the MACD line crosses the signal line from below.
-
Go short when the MACD line crosses the signal line from above.
Signals are far stronger if there is either:
- a divergence on the MACD line; or
- a large swing above or below the zero line.
Unless there is a divergence, do not go long if the signal is above the zero
line, nor go short if the signal is below zero.
Place stop-losses below the last minor Low when long, or the last minor High when short.
Example
Microsoft Corporation chart with: blue MACD, and red MACD signal line.
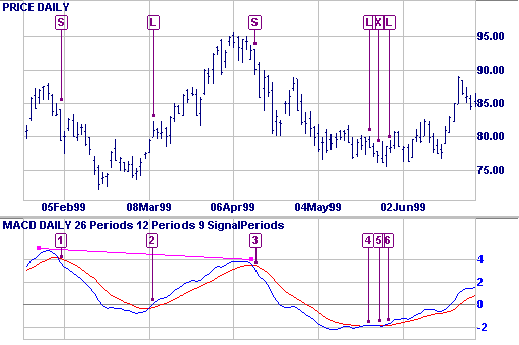
- Go short [S] - MACD crosses to below the signal line after a large swing.
- Go long [L] when MACD crosses to above the signal line.
- Strong short signal [S] - the MACD crosses after a large swing and bearish
divergence (shown by the fuchsia).
- Go long [L]. Flat MACD signals that the market is ranging - we are more
likely to be whipsawed in/out of our position.
- Exit long trade [X] but do not go short - MACD is significantly below the
zero line.
- Re-enter your long trade [L].
Setup
The default settings for the MACD are:
- Slow moving average - 26 days
- Fast moving average - 12 days
- Signal line - 9 day moving average of the difference between fast and
slow.
- All moving averages are exponential.
Construction
Johnson & Johnson with fuchsia
a 12 day, and aqua
a 26 day exponential
moving average(EMA) plotted on the price chart. blu
MACD is calculated as the difference between the fast and slow EMA. The red signal line is calculated as a 9 day EMA of the
MACD line.
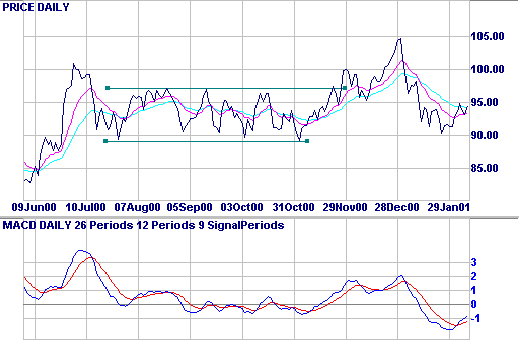
Observe that:
- The MACD line is furthest from the zero line when the gap between the two
EMAs is widest.
- The MACD line is at zero when the two EMAs cross (the trading signal when
using two
moving averages).
- When MACD fluctuates between 1.0 and -1.0 on the above chart, the market
is likely to be ranging.
>